How to Train a ML Model to Defeat APT Cyber Attacks
Round 1: Introducing Fuchikoma
Round 2: Fuchikoma VS CyAPTEmu: The Weigh In
Round 3: Fuchikoma v0: Learning the Sweet Science
Round 4: Fuchikoma v1: Finding the Fancy Footwork
Round 5: Fuchikoma v2: Jab, Cross, Hook, Perfecting the 1-2-3 Punch Combo
Round 6: Fuchikoma v3: Dodge, Counterpunch, Uppercut!
In preparation for the second round of MITRE ATT&CK evaluations, C.K. Chen and team went about designing an emulation of an APT attack, which they named CyCraft APT Emulator, or CyAPTEmu for short. CyAPTEmu’s goal was to generate a series of attacks on Windows machines. Then, a proof of concept threat hunting machine learning (ML) model was designed to specifically detect and respond to APT attacks. Its name is Fuchikoma.

Fuchikoma v0: the baby years
The thought experiment Fuchikoma v0 model gave insight into the four main challenges when designing a threat hunting ML model: having a weak signal, imbalanced data sets, a lack of high-quality data labels, and the lack of an attack storyline.
Fuchikoma v0 VS CyAPTEmu went as well as could be expected.

Weeeeeeeeeeeeeeeeeeeeeee!
Not well at all.
Fuchikoma v1: entering childhood
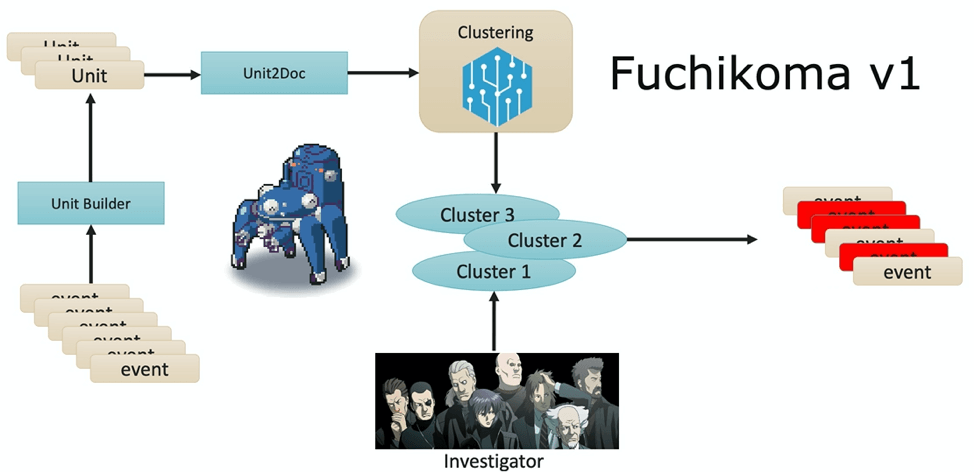
Fuchikoma v1 resolved the first challenge: having a weak signal. An analysis unit (AU) builder was introduced into the ML pipeline; each process creation event was altered into an AU–a mini process tree that links the original process creation event to its direct parent and three tiers of child processes. TF-IDF vectorized the command lines of each event in one AU and placed them into the Unit2Doc. Because each event now had contextual information as an AU, ML algorithms could then group similar AUs into clusters, leaving our investigators with significantly less labeling to be done. While clustering proved to be useful, there were drawbacks.

Fuchikoma v2: fighting its way through adolescence, hormones, and high school
Fuchikoma v2 resolved the second challenge: imbalanced data sets. While similar AUs were still clustered together, the Anomaly Detection component located the most abnormal AUs. As discussed in Part 3, only 1.1 percent of the AUs in our dataset were malicious (or as Fuchikoma reads them, abnormal). The remaining 98.9 percent of the benign AUs could then be clustered together. Our investigators in Section 9 would then only need to investigate and label the clusters containing the most abnormal AUs as dictated by the Anomaly Detection component. By removing the majority of the AUs from inspection, Fuchikoma v2 resolved the issue of imbalanced data sets and dramatically reduced investigation time.
Then something magical happened.

Every teenager, even Fuchikoma v2, gets a tiny victory from time to time. Enjoy it, Kiddo!
Fuchikoma v2 knocked down CyAPTEmu!
However, the boxing match was far from over. CyAPTEmu was down but not out.
Fuchikoma v3: entering young adulthood but can’t afford rent in a nice part of town
Fuchikoma v1 and Fuchikoma v2 had both failed to resolve the two remaining challenges in designing a threat-hunting machine learning model: reducing the difficulty of retrieving high-quality labels and the creation of an attack storyline.
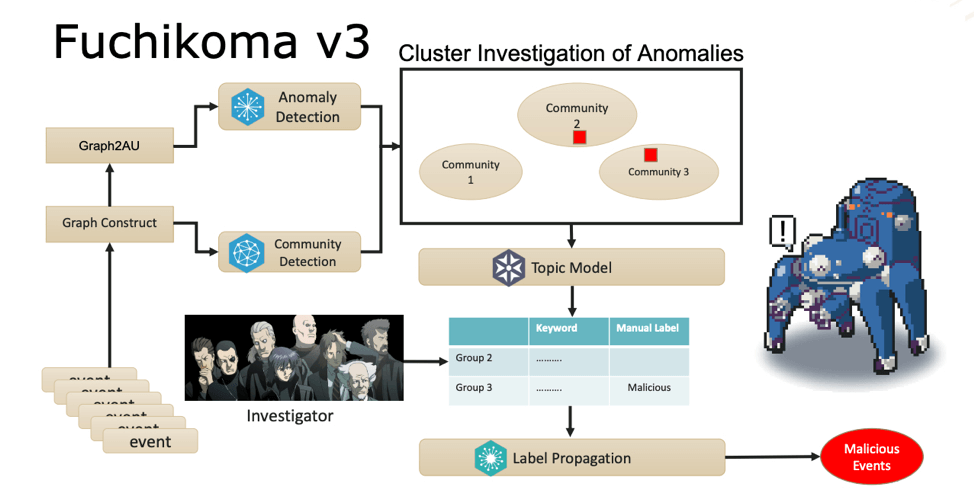
In order to resolve these issues, C.K. Chen and team added several new components to the Fuchikoma v3 pipeline: Graph Construction, Community Detection, Topic Model, and Label Propagation.
Graph Construction
Before the process creation events are sent to the AU Builder (now labeled Graph2AU), they are first sent to the newly added Graph Construct component. Here, all the process creation events on one endpoint are constructed into one massive process tree.
In later versions of Fuchikoma, the GraphConstruct component will be able to incorporate IP addresses and hostnames thereby extending the process tree to include process events across endpoints and link them together; it will include more event types other than create process which are capable of showing lateral movement, such as WMIC.
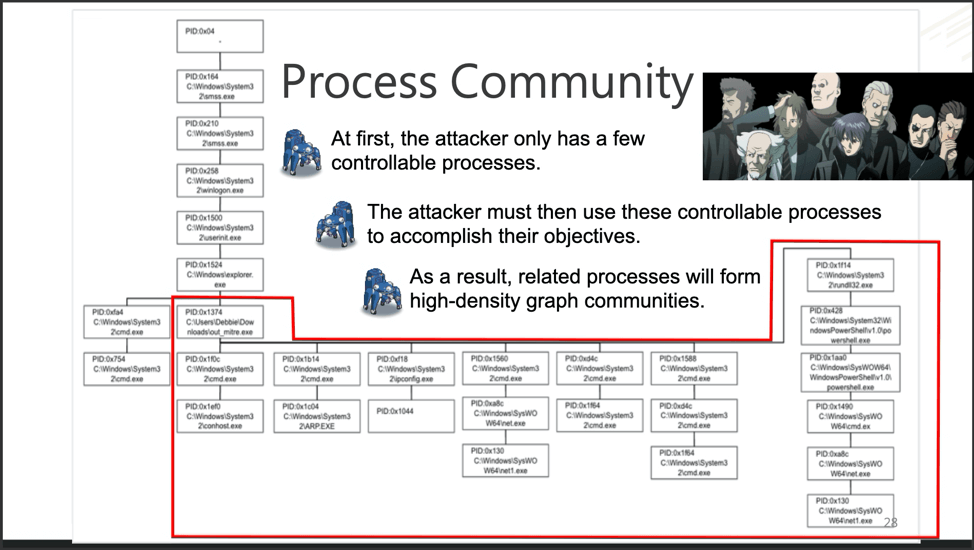
The Graph Construct of one endpoint. Debbie, you’re not winning any fans from tech support.
Above we see an example of a Graph Construct for one endpoint. The Graph Construct maps all the relations of all the process creation events for each endpoint. Once constructed, the data gets sent to both Graph2AU and Community Detection.
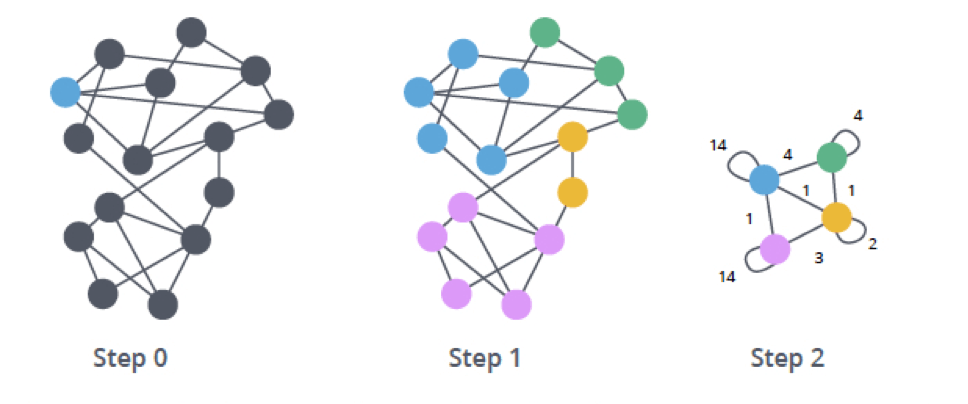
As discussed in Part 5, the Graph2AU (formerly known as AU Builder) constructs AUs, which are then fed into the Anomaly Detection and clustering components. Fuchikoma v3 now expands upon this by merging nodes (an endpoint’s process creation events) into high-density clusters via Community Detection. A group of nodes is said to have high-density when there are high levels of connectivity and similarity across multiple dimensions.
Community Detection
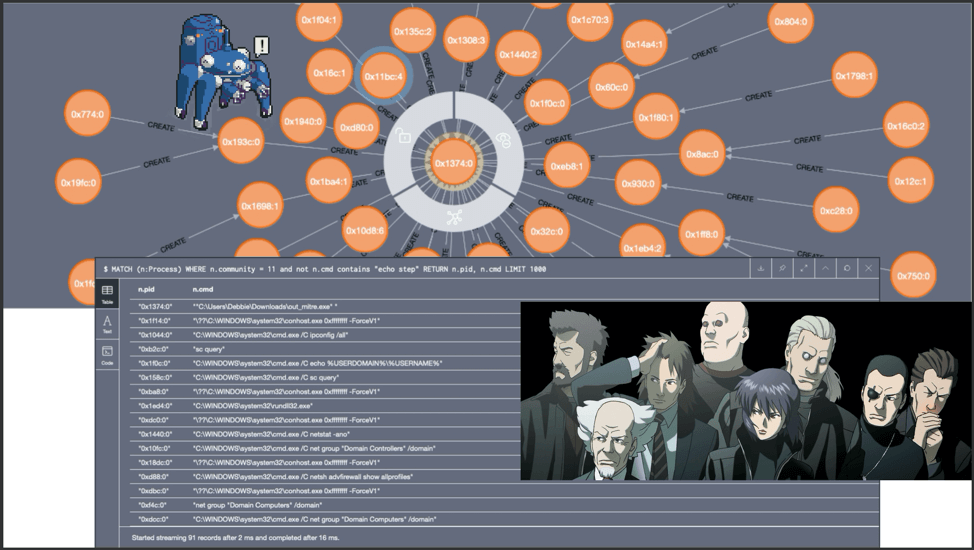
Closer inspection on the above Graph Construct identifies Process 0x1374 as the root cause of the attack for this particular endpoint.
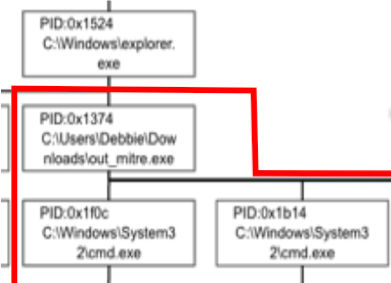
After inspecting Process 0x1374 more closely, it seems that the user Debbie, made a big boo-boo. Debbie most likely clicked on a phishing email link and triggered an executable. That one controllable process created seven malicious child processes, which each generated one to five more malicious processes.
This “Debbie” process group (outlined in red) has high density–the nodes (process creation events)
have high connectivity and similarity across multiple dimensions, such as WMIC and PSExec.exe. Groups with high density are called communities. Communities, such as Debbie’s here, would be ideal for Fuchikoma to cluster as malicious events would (as seen with Debbie’s debacle) also have high connectivity and similarity. Detecting the community structure exhibited by adversarial techniques and being able to track them are crucial steps toward automating the SOC alert verification process and constructing our eventual attack storyline. Clustering as many malicious events together would also limit the number of clusters for our investigators to label.
The Community Detection component detects community structures across all process creation events–not just malicious ones. Related benign events also exhibit high density. This can be done by leveraging ML algorithms, such as the Louvain Modularity algorithm. Created by Professor Blondel et al. from the University of Louvain, the Louvain Modularity algorithm is a hierarchical clustering algorithm that recursively merges communities into a single node based on their modularity–the module they were a part of in the previous iteration. (A module is the same thing as a cluster/group/community).
